PROCONE Software Brochure
Software Downloads
Free trial software is available for download. The trial version will run for 3 days. You may use your own data during evaluation.JTI Software is Windows® based software, supported for Windows 7/ 8/ 8.1/ 2008/ 2012 and is available for lease in a stand-alone and network version for three users. When you are ready to place an order, email us.
PROCONE©
is a reservoir engineering tool for coning analysis. It provides quick, straightforward performance analysis of reservoirs with gas caps and/or aquifers. With its advanced features, it can be utilized to perform stand-alone evaluations, or can serve as a screening tool for more advanced studies.
Features:
- 41 different coning correlations
- Ability to select multiple correlations
- Horizontal and vertical wells
- Fluid systems:
- Oil-Water
- Gas-Oil
- Gas-Water
- Gas-Oil-Water
- 9 graph types
- Multiple curves on each graph
- Overlay production history
- Customize your graphs
- Sensitivity analysis for all input data
The following correlations are present in PROCONE©. The user can choose one, or see the results of all correlations applicable to the well type and fluid system of interest.
Orientation
Fluid System
Forecast Type
Correlation
Horizontal
Gas - Oil
Breakthrough Time
Pietraru
Critical Rate
Chaperon
Joshi
Pietraru
Gas - Oil - Water
Breakthrough Time
Pietraru
Critical Rate
Pietraru
Gas - Water
Breakthrough Time
Pietraru
Critical Rate
Chaperon
Efros
Pietraru
Oil - Water
Breakthrough Time
Ozkan
Papatzacos
Pietraru
Souza
Critical Rate
Chaperon
Efros
Pietraru
Post Water Breakthrough
Mutalik
Souza
Vertical
Gas - Oil
Breakthrough Time
Pietraru
Critical Rate
Meyer
Pietraru
Gas - Oil - Water
Breakthrough Time
Pietraru
Critical Rate
Meyer
Pietraru
Gas - Water
Breakthrough Time
Pietraru
Critical Rate
Chaperon
Hoyland
Meyer
Pietraru
Schols
Oil - Water
Breakthrough Time
Boumazel
Pietraru
Soboncinski
Critical Rate
Chaperon
Chierici
Hoyland
Meyer
Pietraru
Schols
Post Water Breakthrough
Kuo
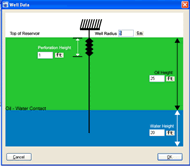
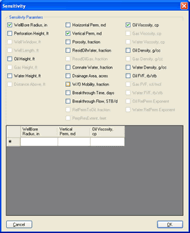
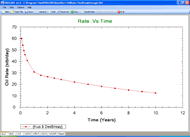
PROCONE© accepts the input data produces Plots/Reports/Data as output files as illustrated by the images below.
Software Interface Examples
(click image to enlarge)


